'%3e%3cpath%20d='M32.6584%203.47205C32.6584%203.47205%2024.5797%203.47205%2024.0632%203.47205C22.6995%203.47205%2021.8435%203.655%2021.29%205.09193C21.3362%204.93269%2022.0264%202.04372%2022.0264%202.04372C22.7167%20-0.076408%2024.2212%200.0330793%2026.024%200.0330793H33.4602L32.6584%203.47205Z'%20fill='%232979FF'/%3e%3cpath%20d='M31.4789%208.55615C31.4789%208.55615%2023.4002%208.55615%2022.8838%208.55615C21.7409%208.55615%2020.6991%208.73589%2020.1106%2010.176C20.1567%2010.0168%2020.847%207.12781%2020.847%207.12781C21.5373%205.00769%2023.0417%205.11705%2024.8446%205.11705H32.2807L31.4789%208.55615Z'%20fill='%232979FF'/%3e%3cpath%20d='M23.6608%2010.1623C21.8579%2010.1623%2020.3535%2010.0528%2019.6632%2012.1729C19.6632%2012.1729%2019.4065%2013.2472%2019.1958%2014.1218C18.7159%2015.2423%2018.2671%2015.4753%2016.4264%2015.4753H5.26103C4.33436%2015.4753%203.11705%2015.967%202.54679%2016.6976C2.54679%2016.6976%200.680897%2019.1051%200%2020C1.03756%2018.93%201.69%2018.9142%204.33397%2018.9142C6.04192%2018.9142%2014.2835%2018.9142%2014.2835%2018.9142C16.2654%2018.8836%2017.9431%2019.161%2018.4967%2017.1895C18.4967%2017.1895%2018.8929%2015.3179%2019.0394%2014.9259C19.535%2013.7956%2020.6288%2013.6013%2021.7%2013.6013C22.2164%2013.6013%2030.2951%2013.6013%2030.2951%2013.6013L31.0969%2010.1623H23.6608Z'%20fill='%232979FF'/%3e%3cpath%20d='M39.713%200.0320587L36.5675%2013.5904H32.7998L35.9978%200.0320587H39.713Z'%20fill='%232979FF'/%3e%3cpath%20d='M12.4977%208.41975L15.6286%204.11642L14.4404%208.41975H12.4977ZM4.7085%2013.5904H8.89106L10.2772%2011.6589H13.69L13.2425%2013.5904H17.01L20.1717%200.0320587H15.2318L4.7085%2013.5904Z'%20fill='%232979FF'/%3e%3c/g%3e%3cdefs%3e%3cclipPath%20id='clip0_42_106'%3e%3crect%20width='39.7436'%20height='20'%20fill='white'/%3e%3c/clipPath%3e%3c/defs%3e%3c/svg%3e)
The Housing and Economic Analysis Toolkit
Housing market data and policy insights for unlocking naturally affordable housing·Subscribe
Recently Used
Featured Tools
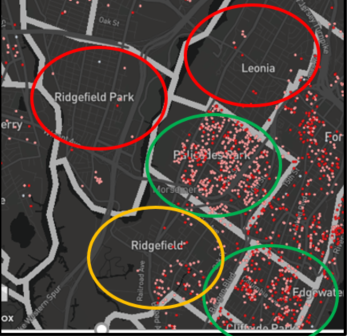
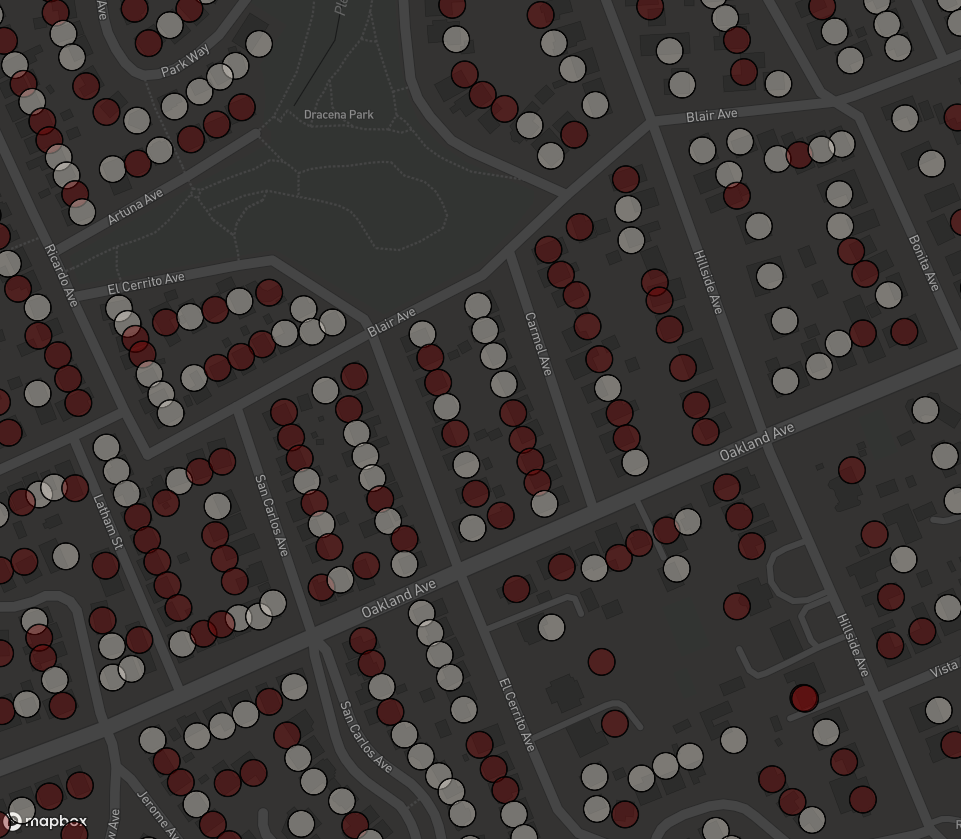
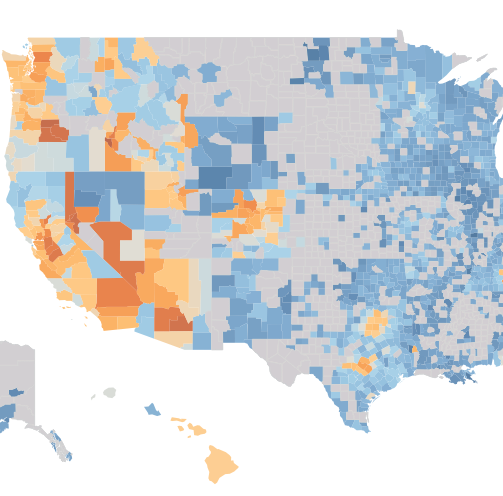
Residential Year Built and Land Use Map
Browse residential properties by year built across the nation
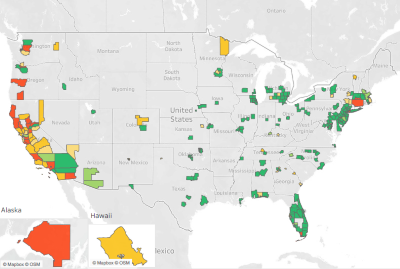
State Housing Supply Legislation Tracker
Potential homes enabled by current state housing legislation
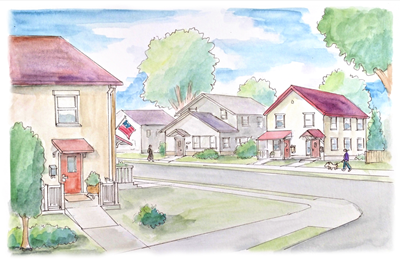
Light Touch Density Map
Find America's LTD opportunities

Livable Urban Villages
LUV (Livable Urban Villages) holds the key to sustainable growth

McMansion Map
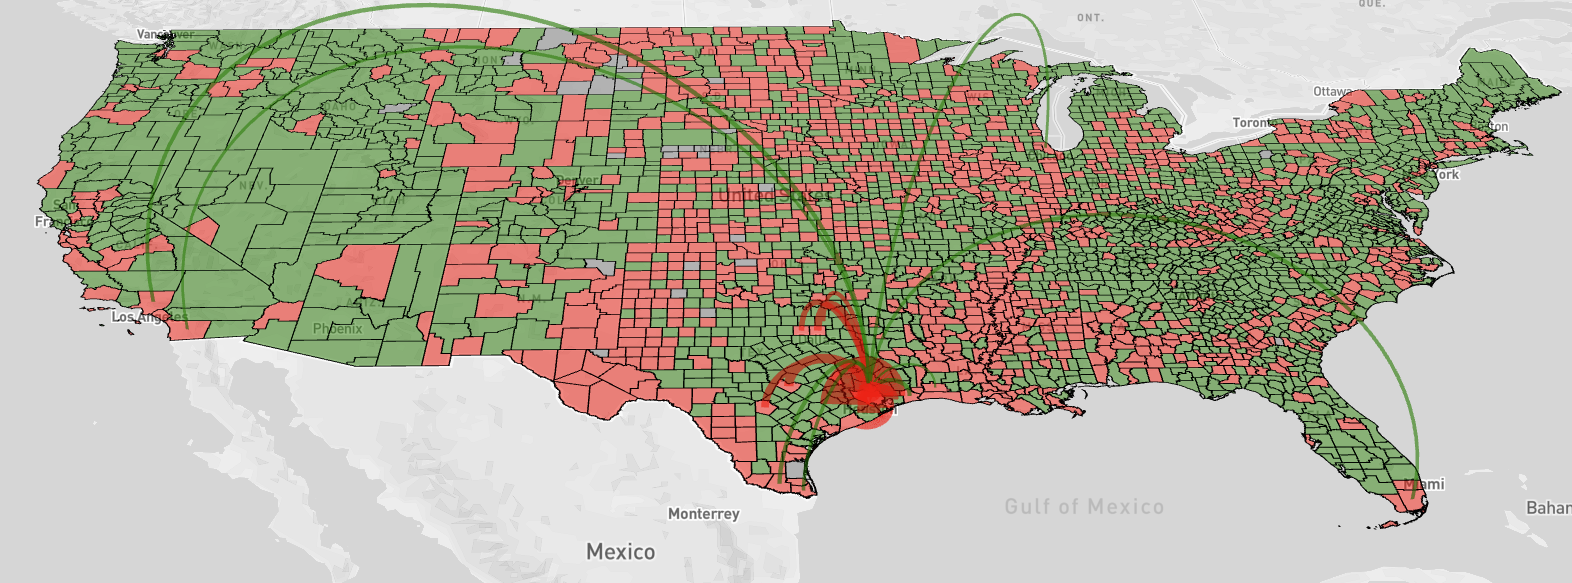
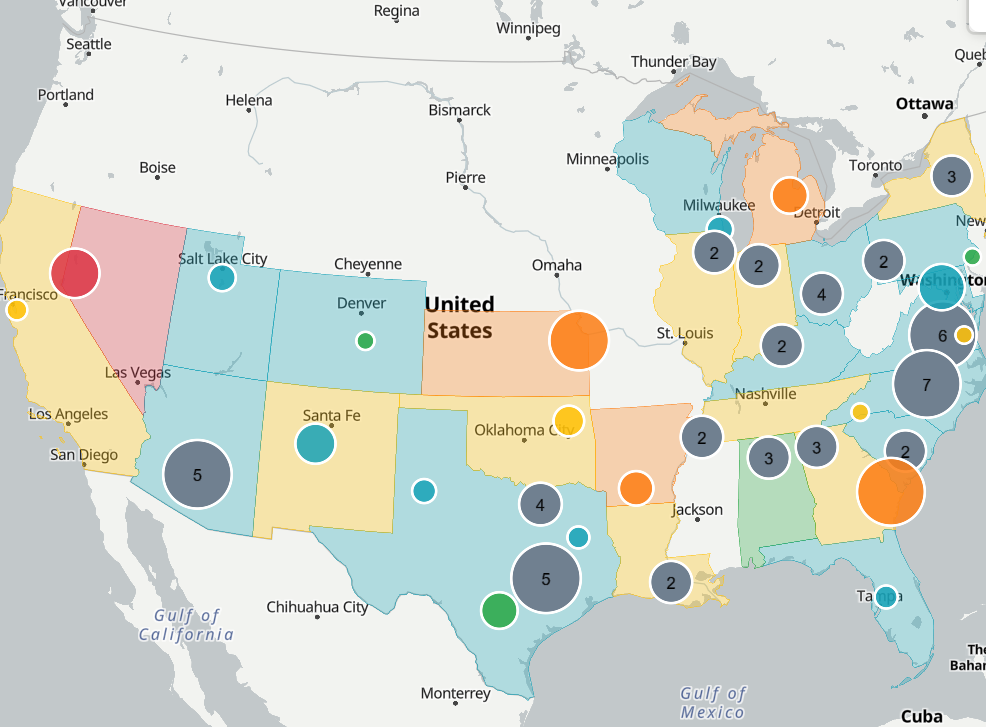
IRS Migration Map
State migration flows based off of IRS data

Housing Center Playbooks
Strong Foundations for Housing and Economic Growth
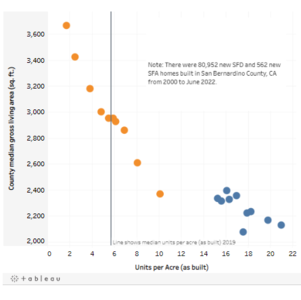
New Home Construction and As-Built Density Relationships
Evaluate the relationship among gross living area, current value, as-built density for newly constructed homes
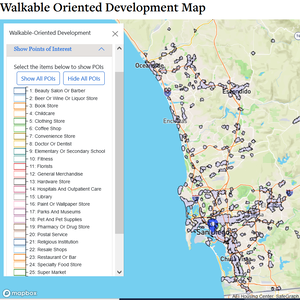
Walkable Oriented Development
WOD would bring housing closer to service jobs thereby reducing transportation and housing costs, while freeing up time for other activities such as recreation and child care
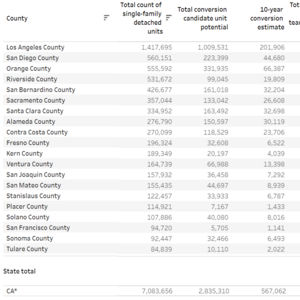
Light Touch Density Supply Estimates
County and city summaries of LTD's potential to add housing supply via infill and greenfield
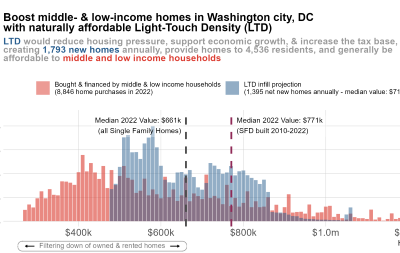
Light Touch Density Price Chart
Boost middle and low-income housing with Light-touch Density
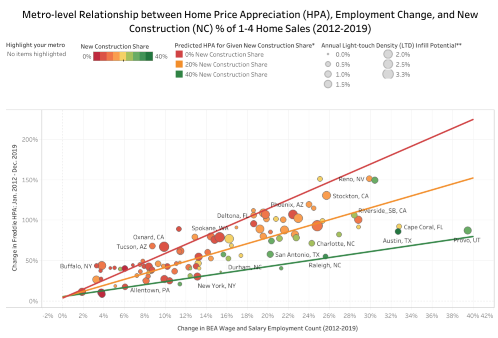
Metro Supply & Demand
The relationship at the metro level between housing stock, home price appreciation, and employment growth
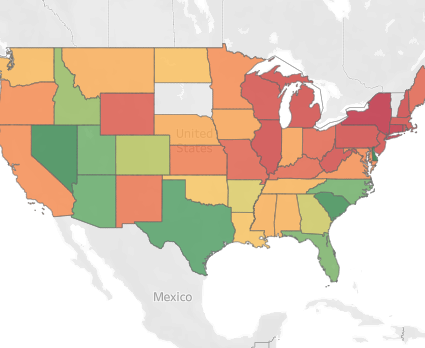
New Construction (State and County)
New Construction Trends for States, Metros, and Counties
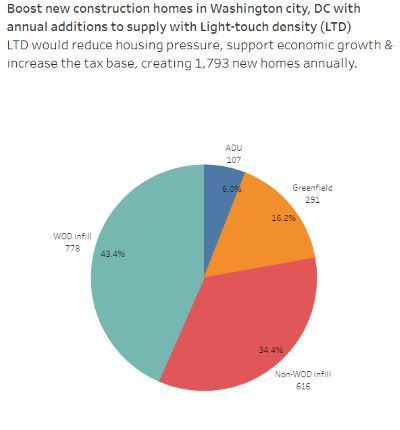
Housing Playbook Supply Composition by Geography Level
How Following the Housing Playbook Can Help Alleviate the Housing Shortage
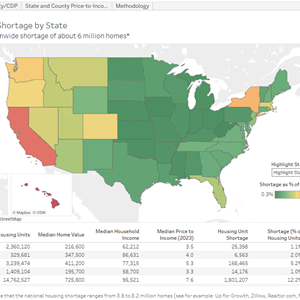
U.S. Housing Shortage by State, County, and City
Assuming a nationwide shortage of about 6 million homes
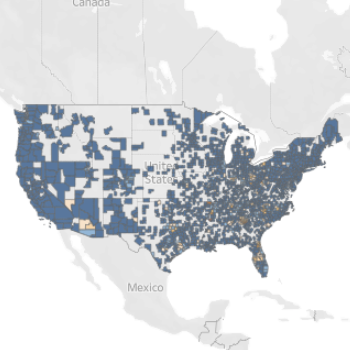
Investor Owned SFR as a Percentage of County Total SF Stock
Investor Owned SFR as a Percentage of County Total SF Stock: 100+ Units in National Portfolio Size
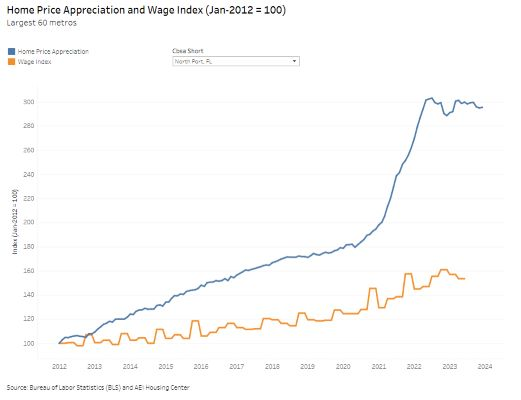
Home Price Appreciation and Wage Index
Evaluate home price and wage trends across metros
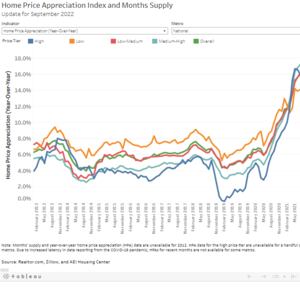
Home Price Appreciation and Months Supply
Evaluate home price trends across metros and price tiers.
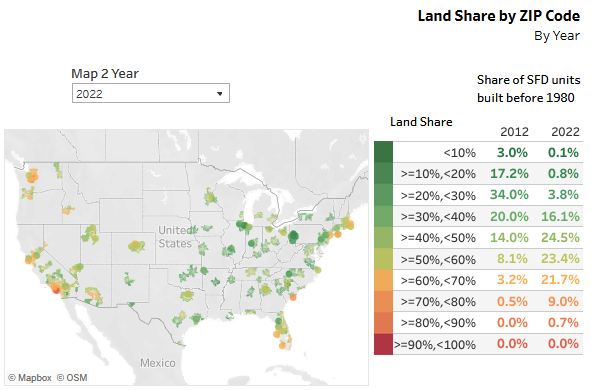
Land Price and Land Share Indicators
Land share by zip code
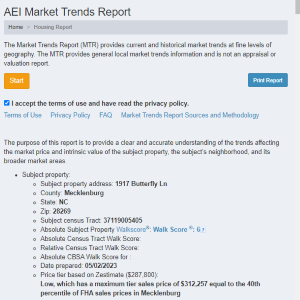
Market Trends Report
The Market Trends Report (MTR) provides current and historical market trends at fine levels of geography.
State and County Housing Market Indicators
Comprehensive insights into various housing indicators, including price, supply, new construction activity, and mortgage risk for most of the country
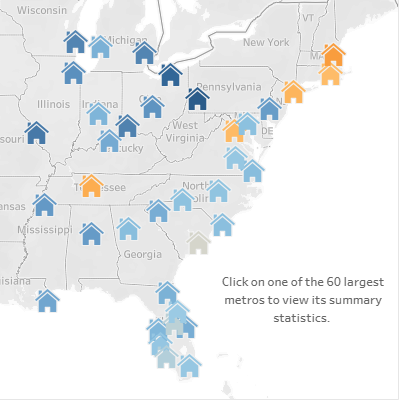
Best and Worst Metro Areas to Be a First-time Homebuyer
This report analyzes over 5 million first-time homebuyer (FTB) sales from 2013 to 2022 for the largest 60 metros. We rank these metros based on their affordability for FTBs by using the ratio of home prices to income for each individual FTB.
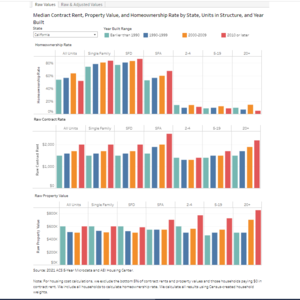
Median Rent and Property Value
Charts with information on rents, home values, and homeownership rates across all states broken down by units in structure and year built
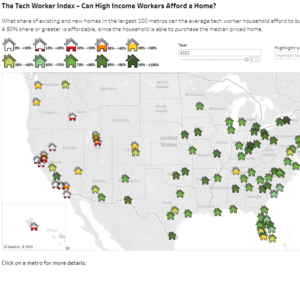
Tech Worker Index
Evaluate how affordable different metros are for the average tech worker.
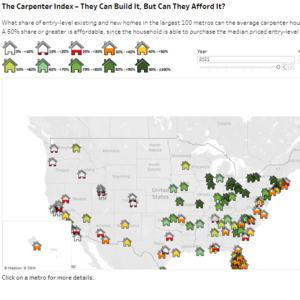
Carpenter Index
Can carpenters afford to buy the houses they build?
Explaining Metro HPA over Time
Understanding the variation in HPA across the top 100 metros for different time periods
Housing Debt to Income (HDTI)
How much income goes to mortgage in the largest 60 metros
Housing Market Indicators (Largest 400 Metros)
Housing affordability, home price appreciation, and employment statistics for the largest 400 metros.
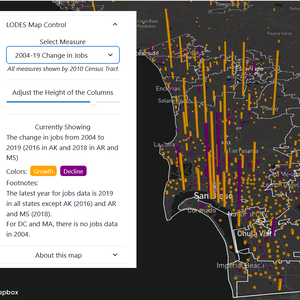
Job and New Construction Growth
Evaluate the relationship at the census tract level between job increases and new home construction
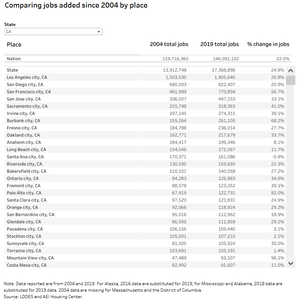
Job Growth
Evaluate comparative job growth trends for cities and unincorporated areas
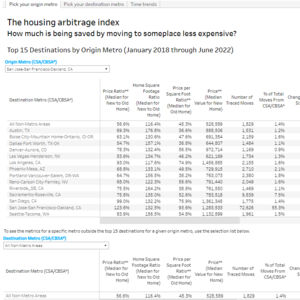
Arbitrage
View where people are moving to and from, buying new homes, and potentially, getting better value.
Factory Housing Report Card
View where people are moving to and from, buying new homes, and potentially, getting better value.
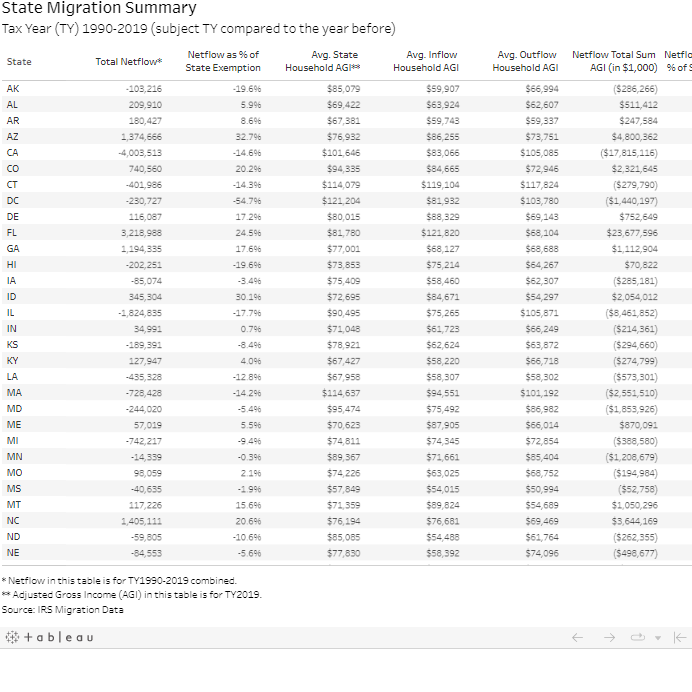
State Migration Summary
State migration flows based off of IRS data
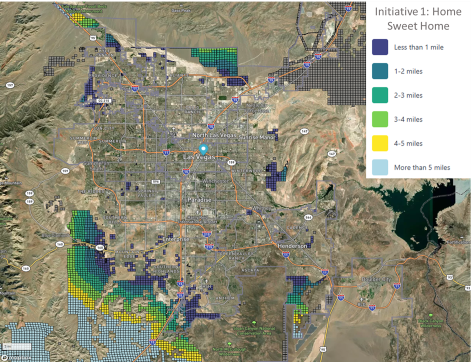
Homesteading 2.0 Map
Mapping the homesteading initiatives that could build 3 million homes on federal land
Media Mentions for Homesteading 2.0, Freedom Cities, and BLM Land
Explore resources on homesteading 2.0, freedom cities, and BLM land.
Homesteading 2.0: A Proposal to Make Housing Affordable Again
An event hosted by AEI and the U.S. Chamber of Commerce
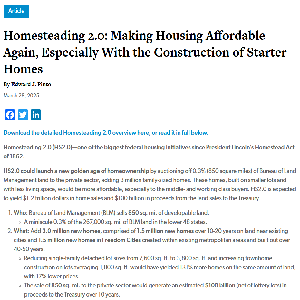
Homesteading 2.0 Overview: Making Housing Affordable Again, Especially With the Construction of Starter Homes
Keys to a new golden age of homeownership
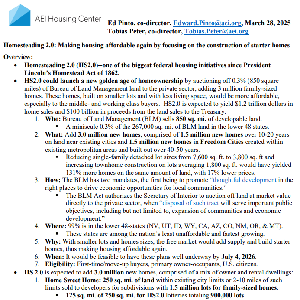
Homesteading 2.0 (Detailed Overview): Making housing affordable again by focusing on the construction of starter homes
Keys to a new golden age of homeownership
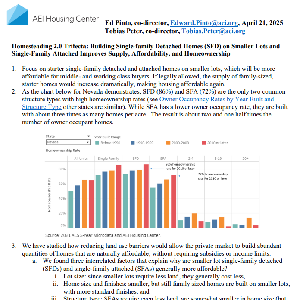
Homesteading 2.0 Trifecta: Building Single-Family Detached Homes (SFD) on Smaller Lots and Single-Family Attached Improves Supply, Affordability, and Homeownership
Building Single-Family Detached Homes (SFD) on Smaller Lots and Single-Family Attached Improves Supply, Affordability, and Homeownership
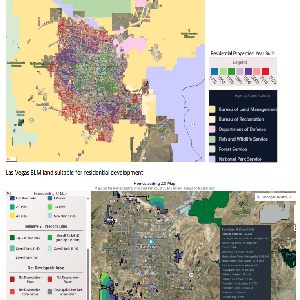
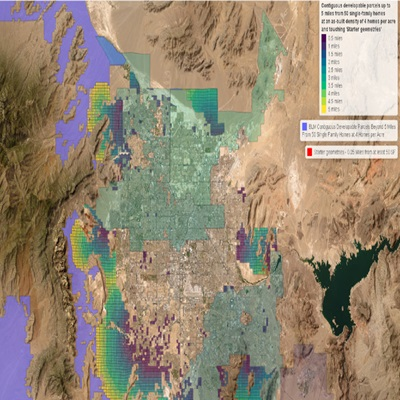
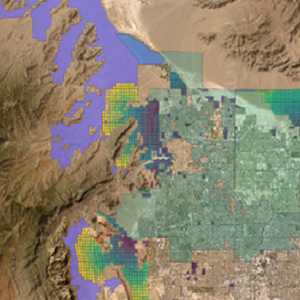
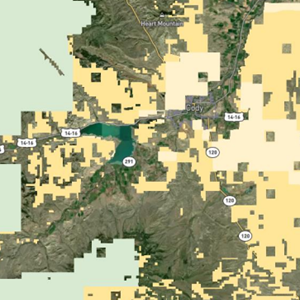
BLM Metros with high developable land potential: Screenshots showing federal land constraint
Screenshots of how constrained the following metros are by federally owned land
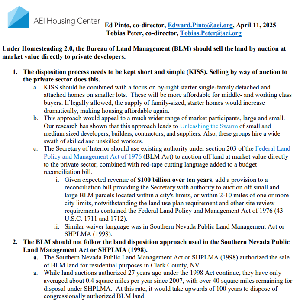
Homesteading 2.0: BLM should sell the land by auction at market value directly to private developers
Keeping the disposition process short and simple
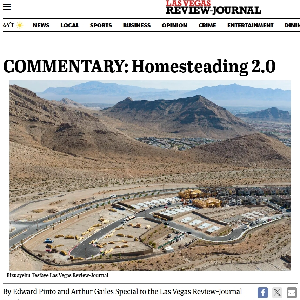
Commentary: Homesteading 2.0
Edward Pinto and Arthur Gailes in the Las Vegas Review-Journal
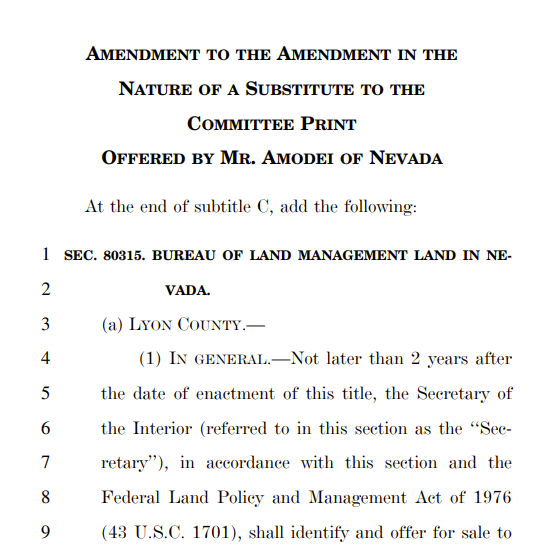
U.S. House Natural Resources Committee BLM Land Sales Reconciliation Bill Amendment
An Amendment from Mark Amodei (R-NV) to the U.S. House Natural Resources Committee
Freedom Cities: Homesteading for the 21st Century
Reviving America's tradition of new communities through private development
Explaining Differences in Metro-level Rates of HPA over Various Periods from 1980 to 2022
We find that the best predictors of Home Price Appreciation (HPA) are total wages*, housing supply, loan leverage, and net migration.

MetroSight: The Case for Light Touch Density
Islands of density in a sea of no growth
Missing Middle Housing: A New Frontier
Presented by Terner Center for Housing Innovation
ADU Legalization at Five
What ADU legislation can teach us for the future of land-use reform in California
Los Angeles Housing Conference Video
Using Data to Promote Light Touch Density and Walkable Oriented Development
California Housing Conference EBook
Using Data to Promote Light Touch Density and Walkable Oriented Development
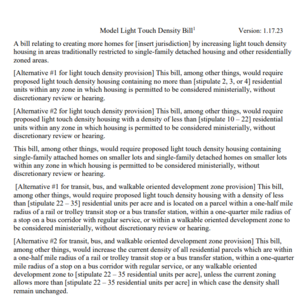
Model Light Touch Density Bill
Model legislation for local governments to adopt light touch density policies
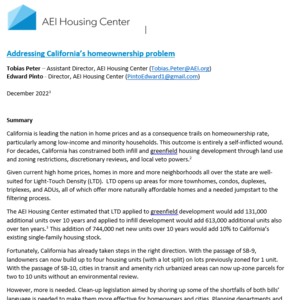
Addressing California's homeownership problem
California is leading the nation in home prices and as a consequence trails on homeownership rate
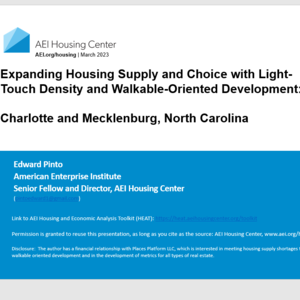
Expanding Housing Supply and Choice
Expanding Housing Supply and Choice with Light-Touch Density and Walkable Oriented Development: Charlotte and Mecklenburg, North Carolina

Walkable Oriented Development (2021)
An Opportunity for an American Renaissance: Walkable Oriented Development
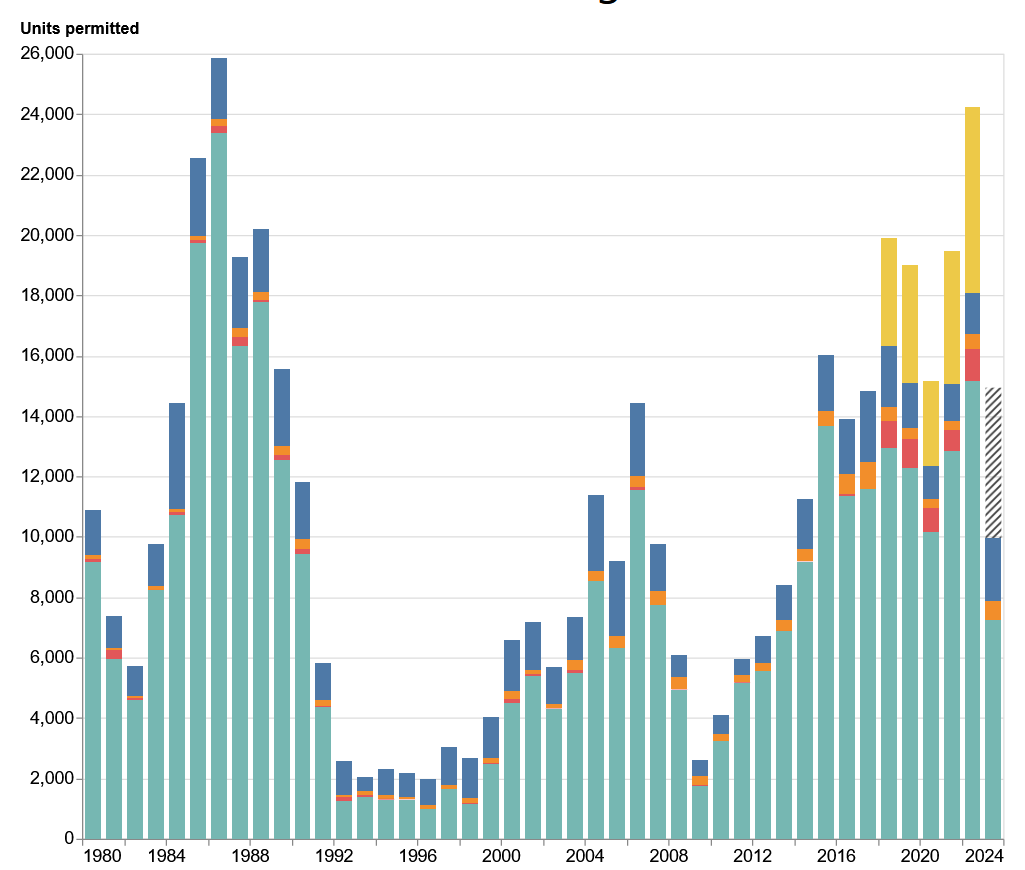
housingdata.app
Data dashboard for the Building Permits Survey - housingdata.app
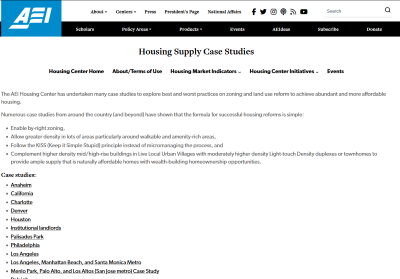
Housing Supply Case Studies
An ongoing series of deep-dives into housing supply across the nation
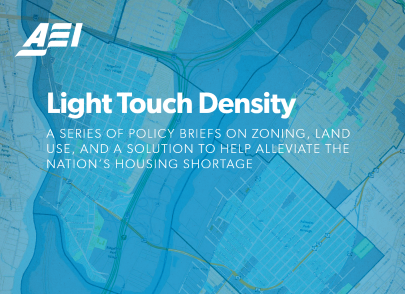
Light Touch Density Ebook
A Series of Policy Briefs on Zoning, Land Use, and a Solution to the Nation’s Housing Shortage
Tutorial: HEAT Toolkit
Mastering Local Housing Market Information with AEI's New HEAT Toolkit
Tutorial: Good Neighbors Toolkit
Mastering Local Homeless Displacement Information with AEI's New Good Neighbors Toolkit

Heat AI (Beta)
Explore the AEI Housing Center's publications and the HEAT Toolkit, all in one place.

State Property Rights Constitutional Provisions
Explore property rights provisions in each state constitution.

Good Neighbors Toolkit
Master Local Homeless Displacement Information with AEI's Good Neighbors Toolkit.